Voltaic

Things I did
Product design
Dashboard UI
Web design
Client
Self-initiated
Year
2026
Platform
Marketing site, operations dashboard, resident app

EV charging for apartment buildings, run from one dashboard. I designed the marketing site that wins over property managers, the operations dashboard they use every day and the app residents charge with.

The challenge

Property managers get asked for EV chargers but can't answer the basics: what it costs, who pays and what happens when one breaks. Once chargers are in, they're blind until a resident complains.

The approach

The site answers the money question first, with a calculator. The dashboard turns a building's chargers into a map, with problems at the top, and residents get an app that sends them to a working bay.
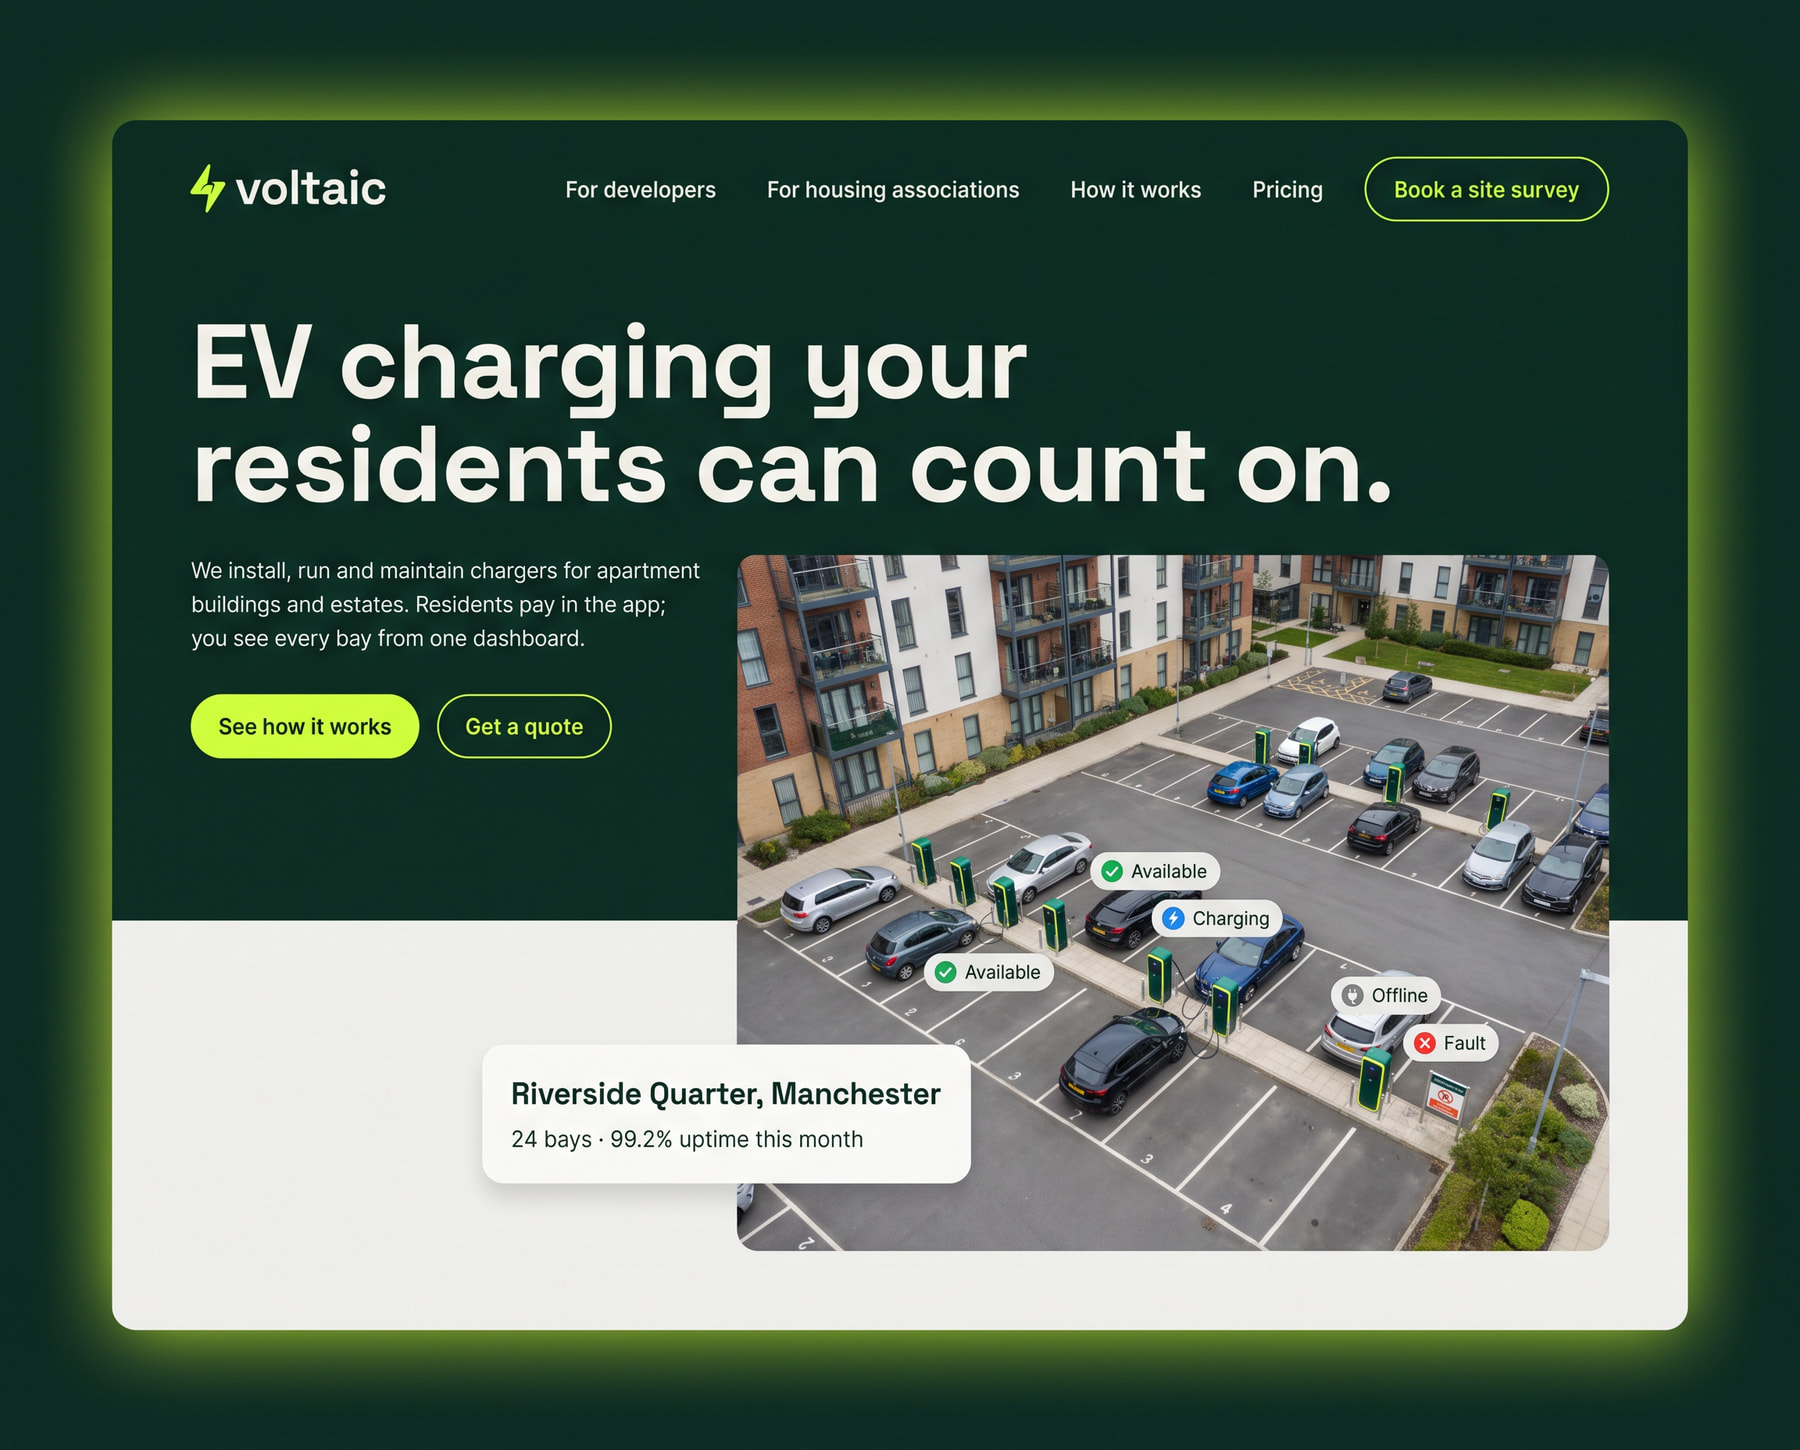
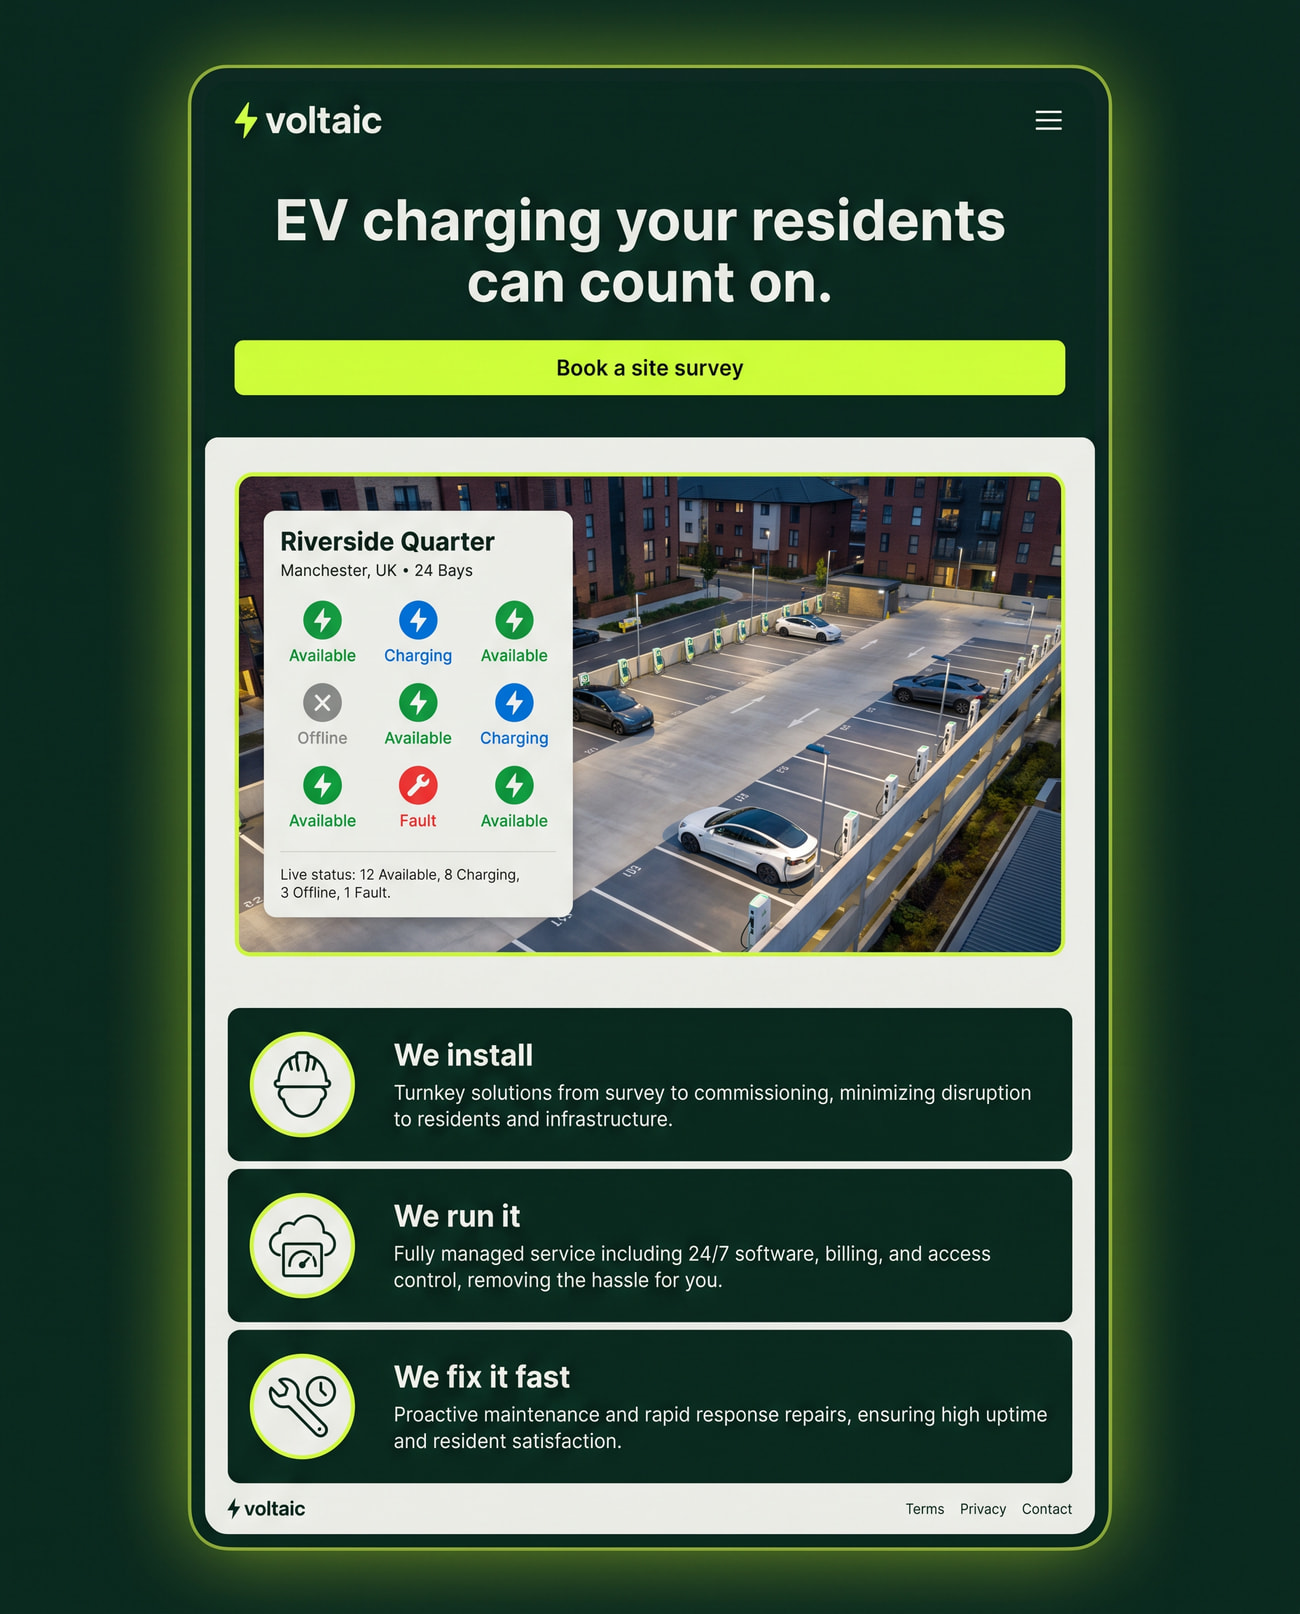
Built for the person who signs off
Starts with your building
The site

Built for the person who signs off

Property managers aren't EV experts, so the homepage starts with what they care about: what it costs, who pays and who fixes a charger when it breaks.
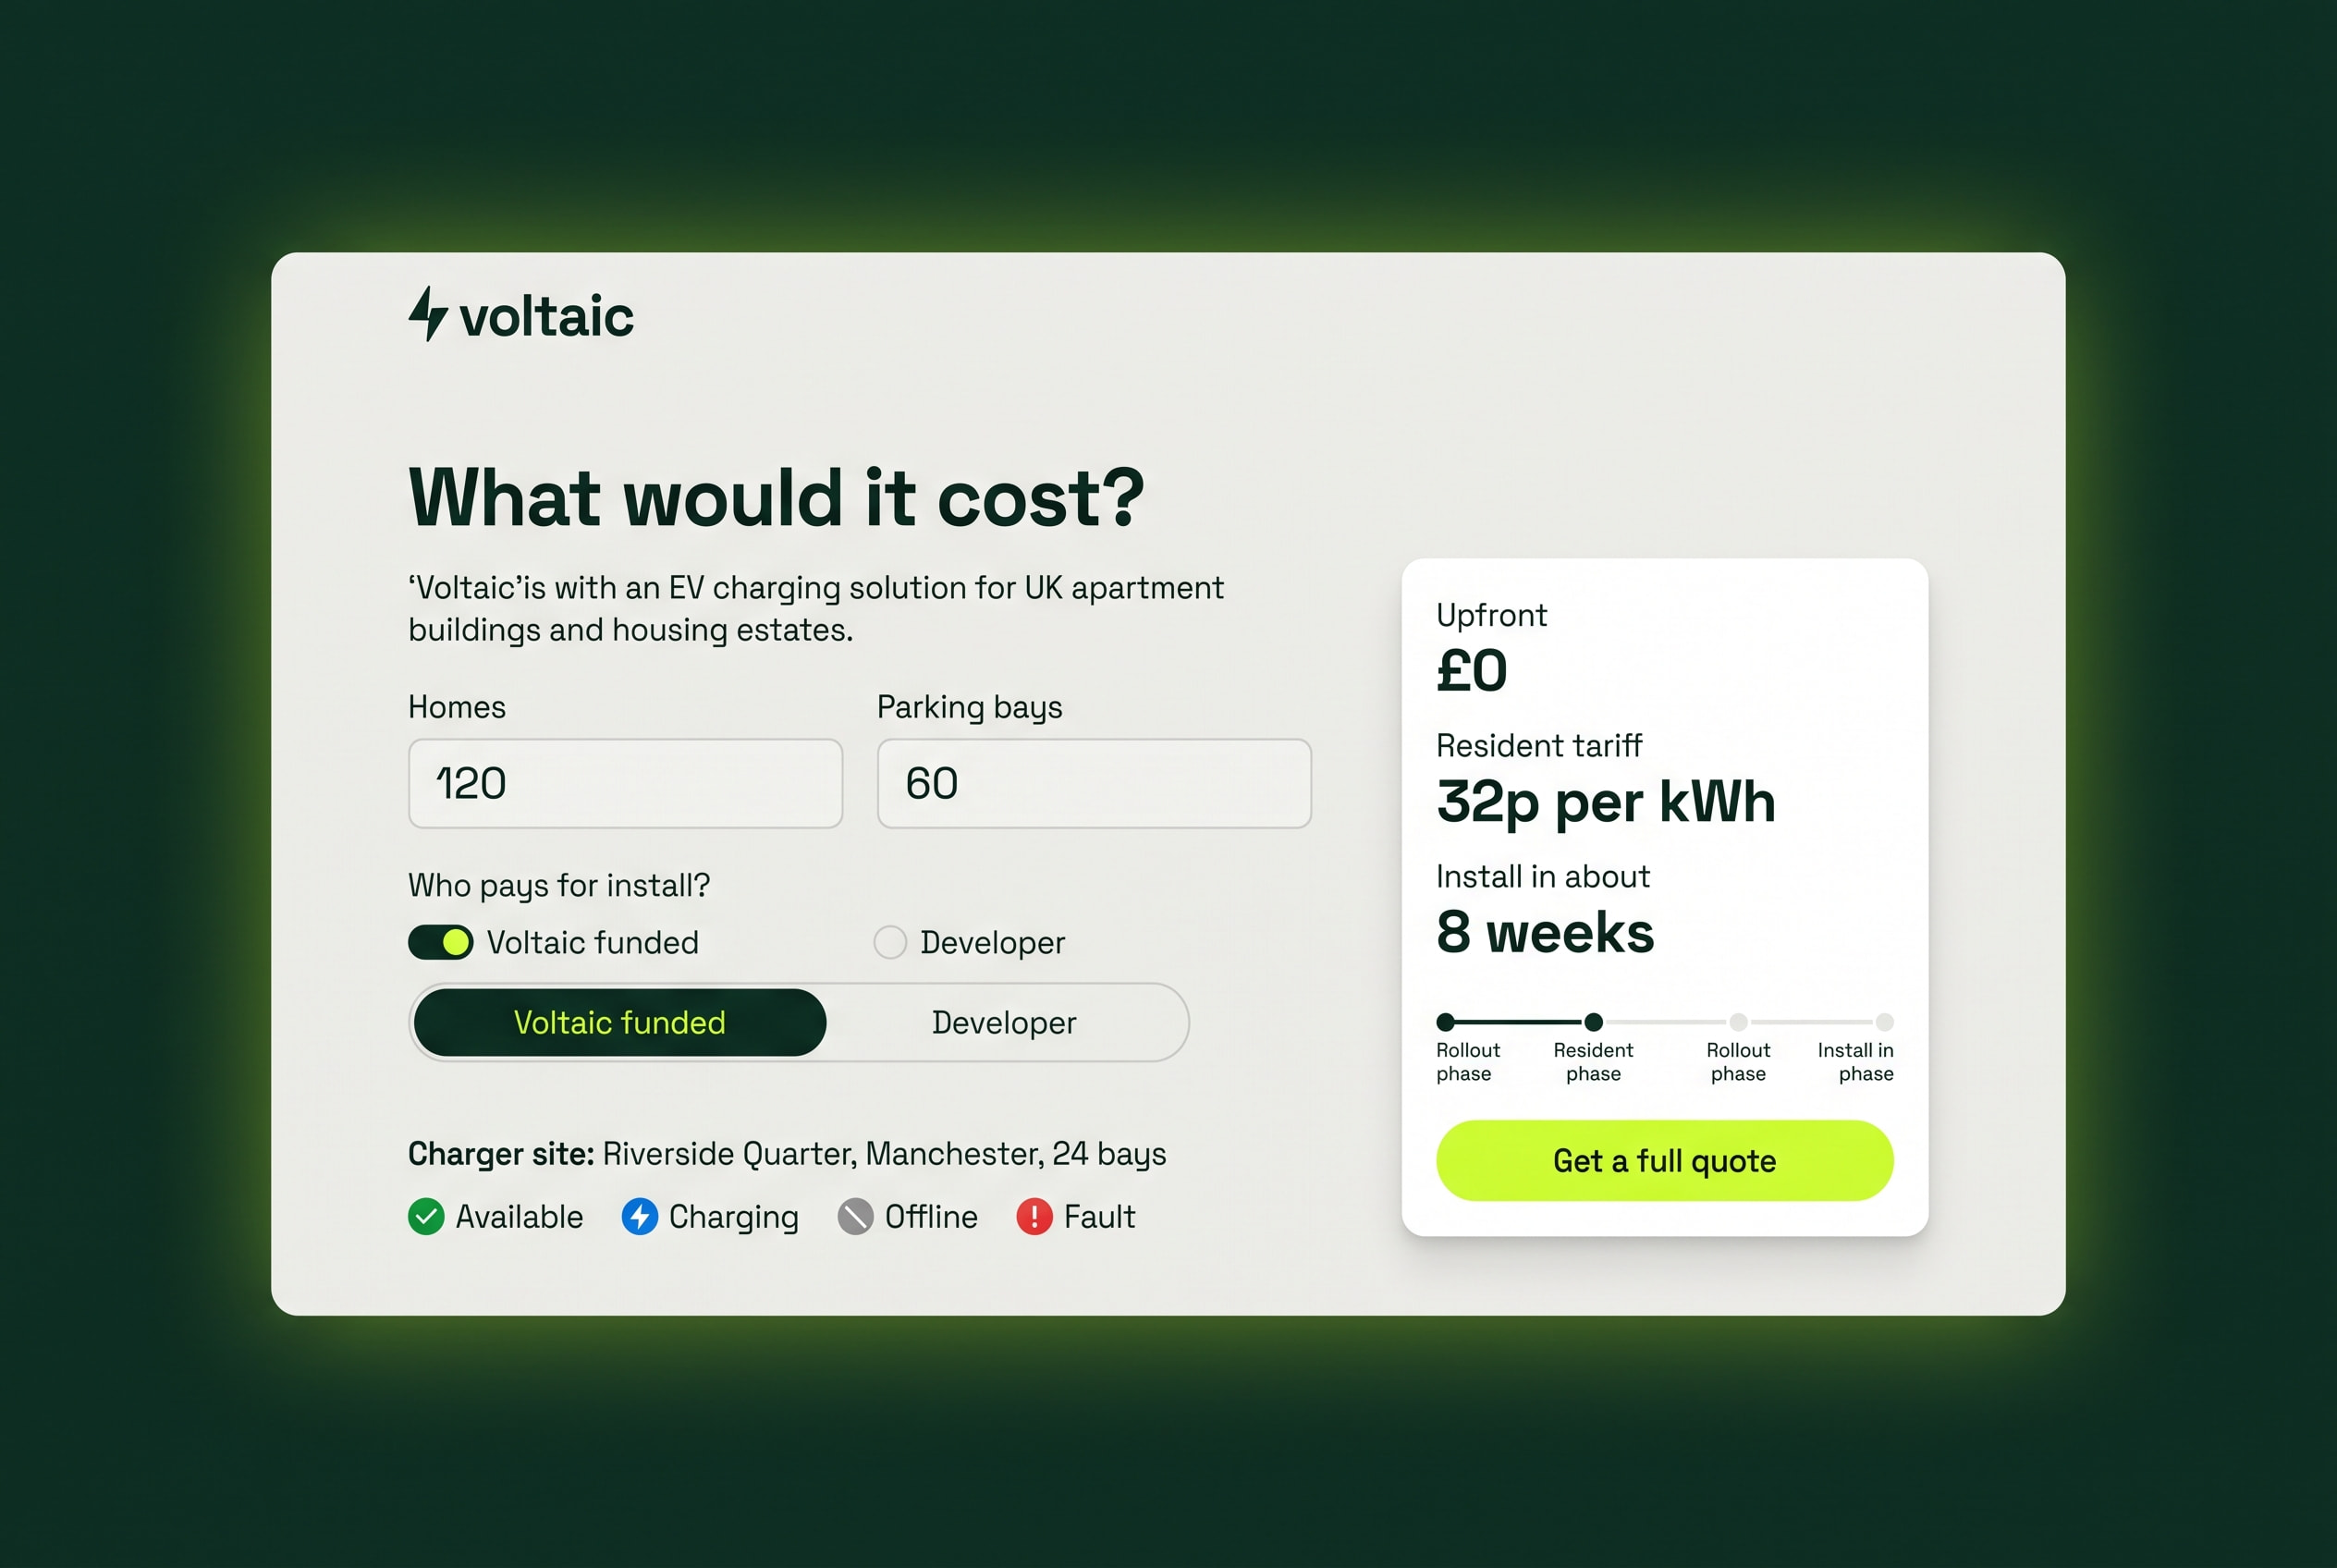
The money question, answered first
Calculator

The money question, answered first

Three inputs (homes, parking bays and who funds the install) give an upfront cost, a resident tariff and an install time. The result carries straight into a quote request.
Every charger on one map
Operations

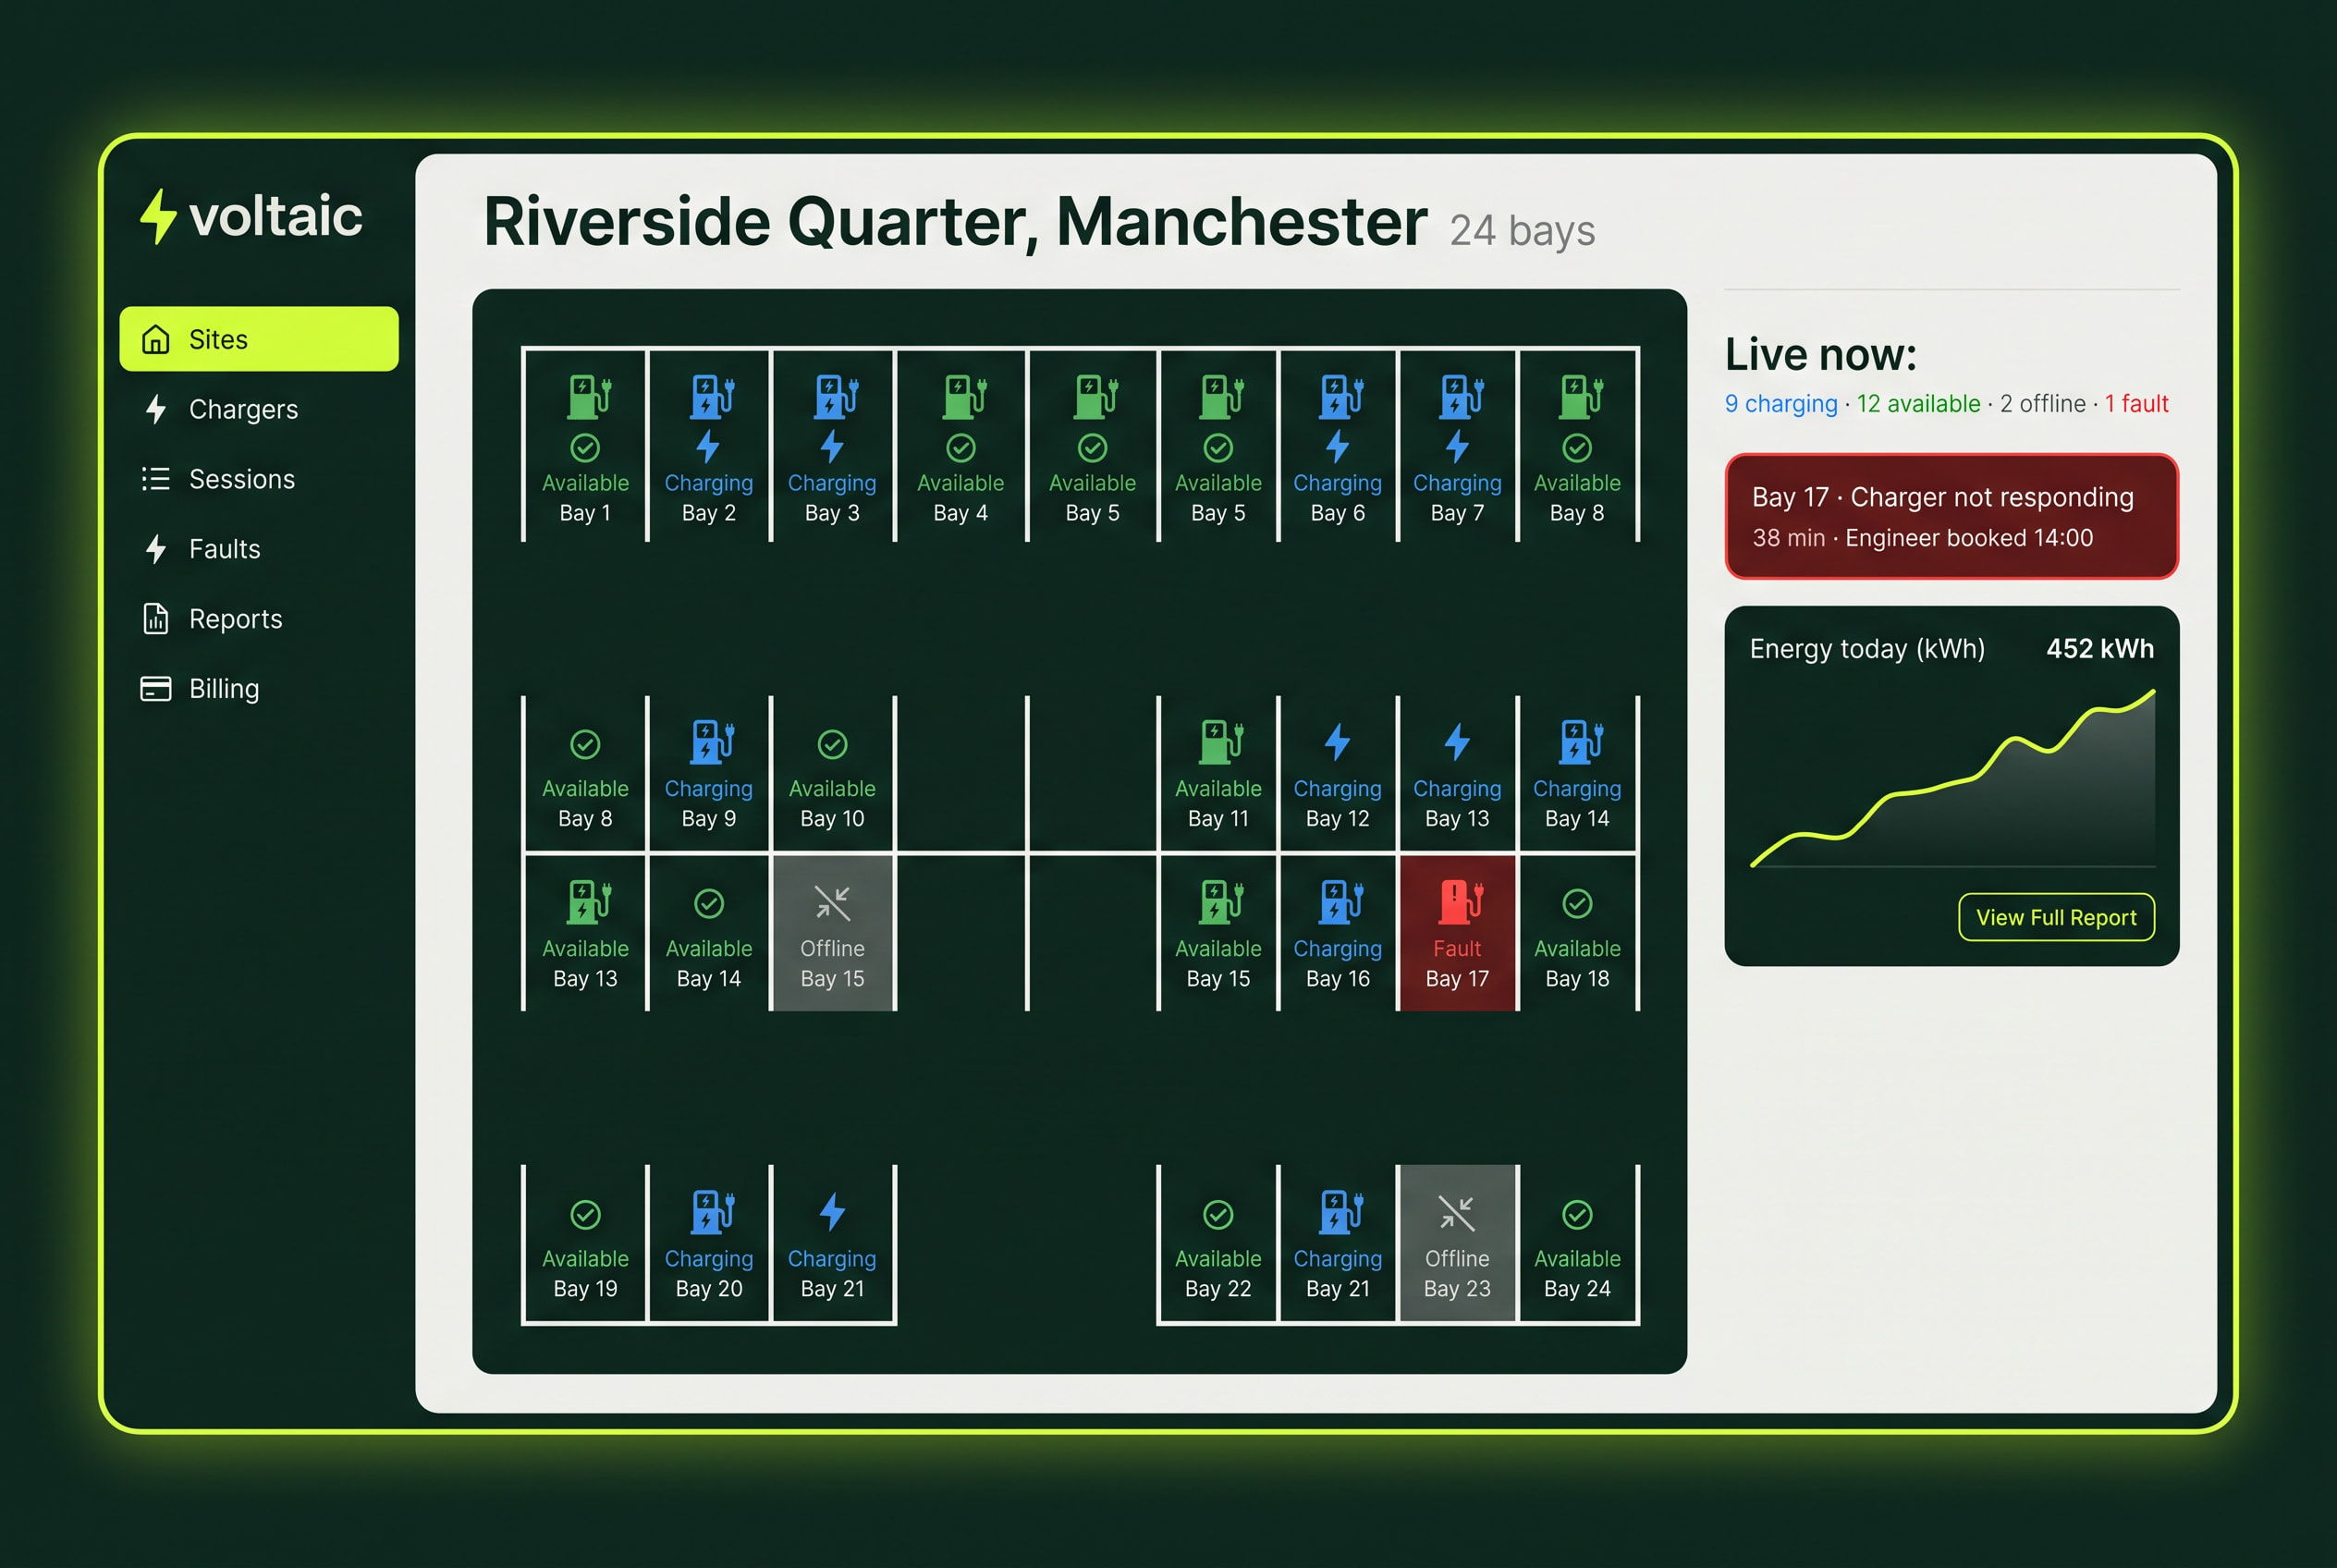
Every charger on one map

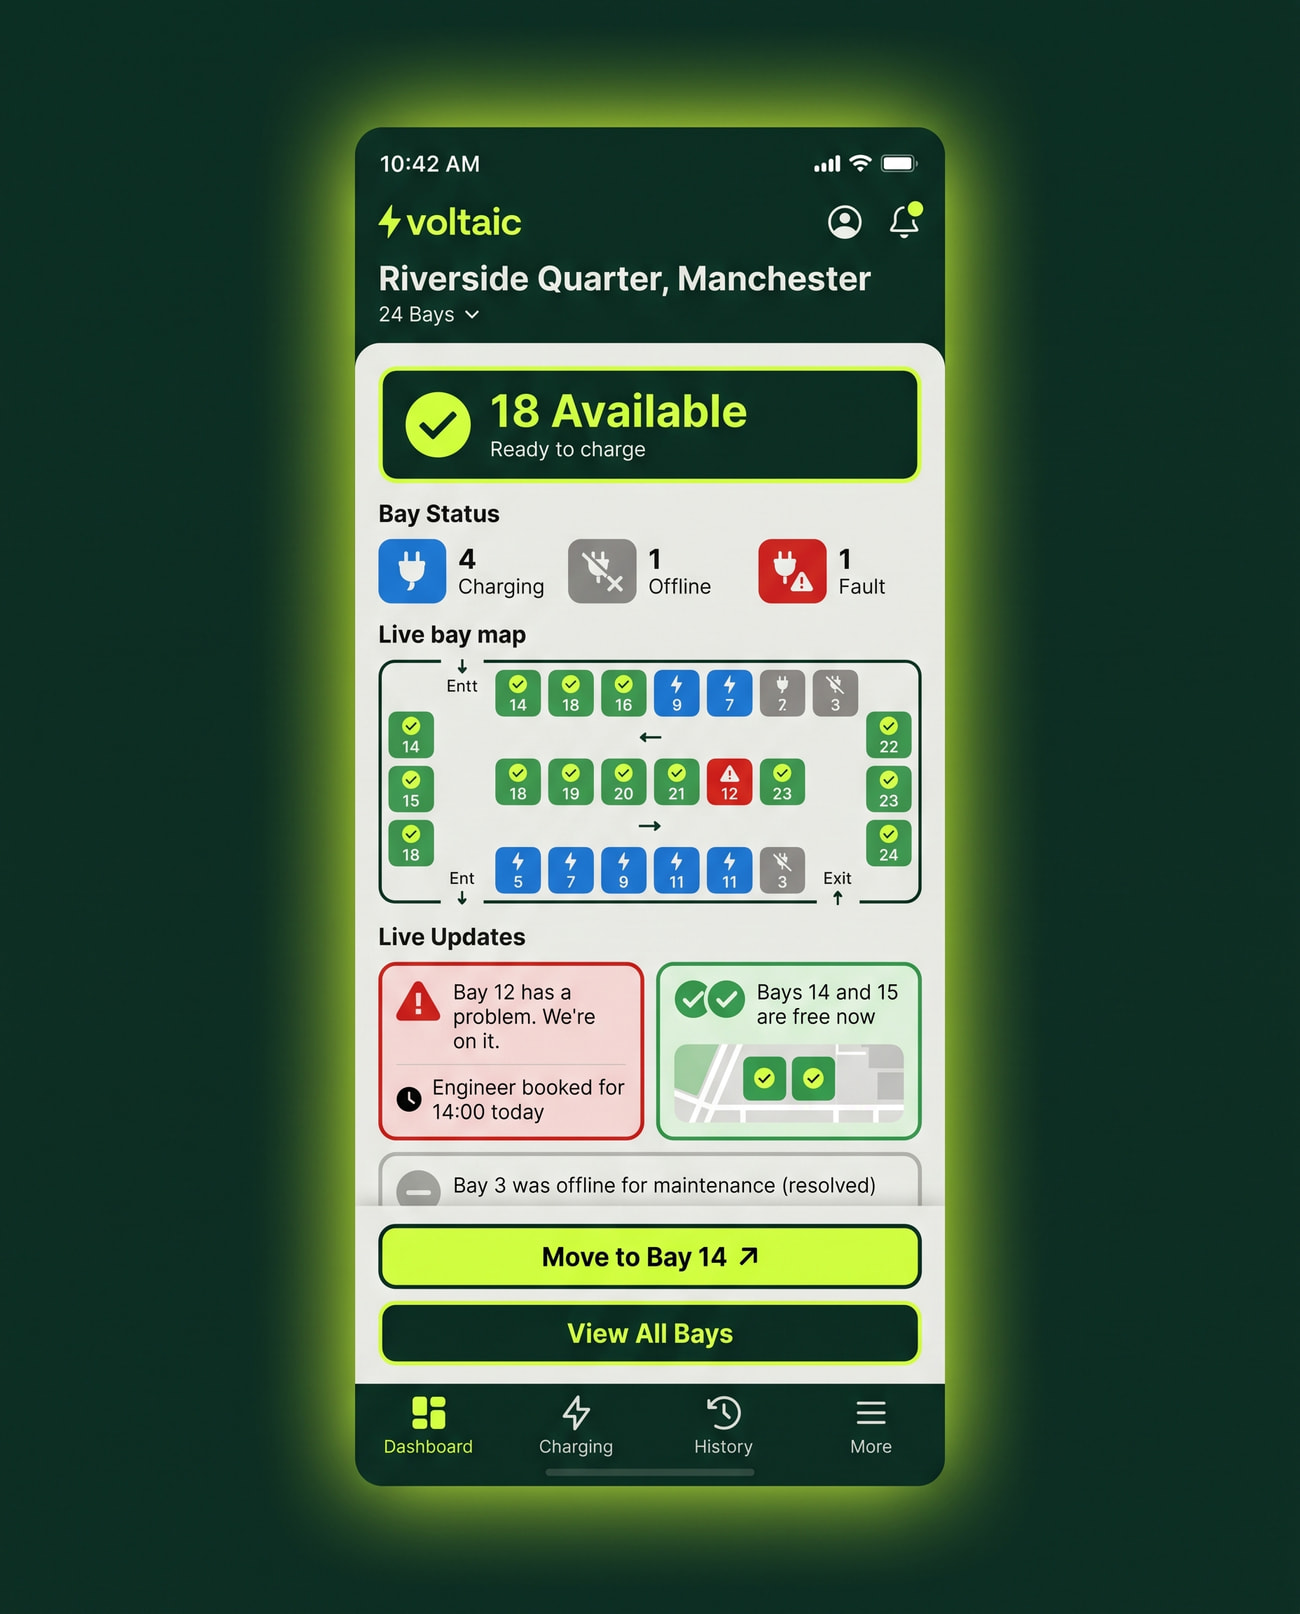
Each site opens on a plan of its bays. Faults sit at the top with what's wrong and who's been sent, so a manager can answer a resident in one look.
From fault to fixed
Never colour alone
Charger detail

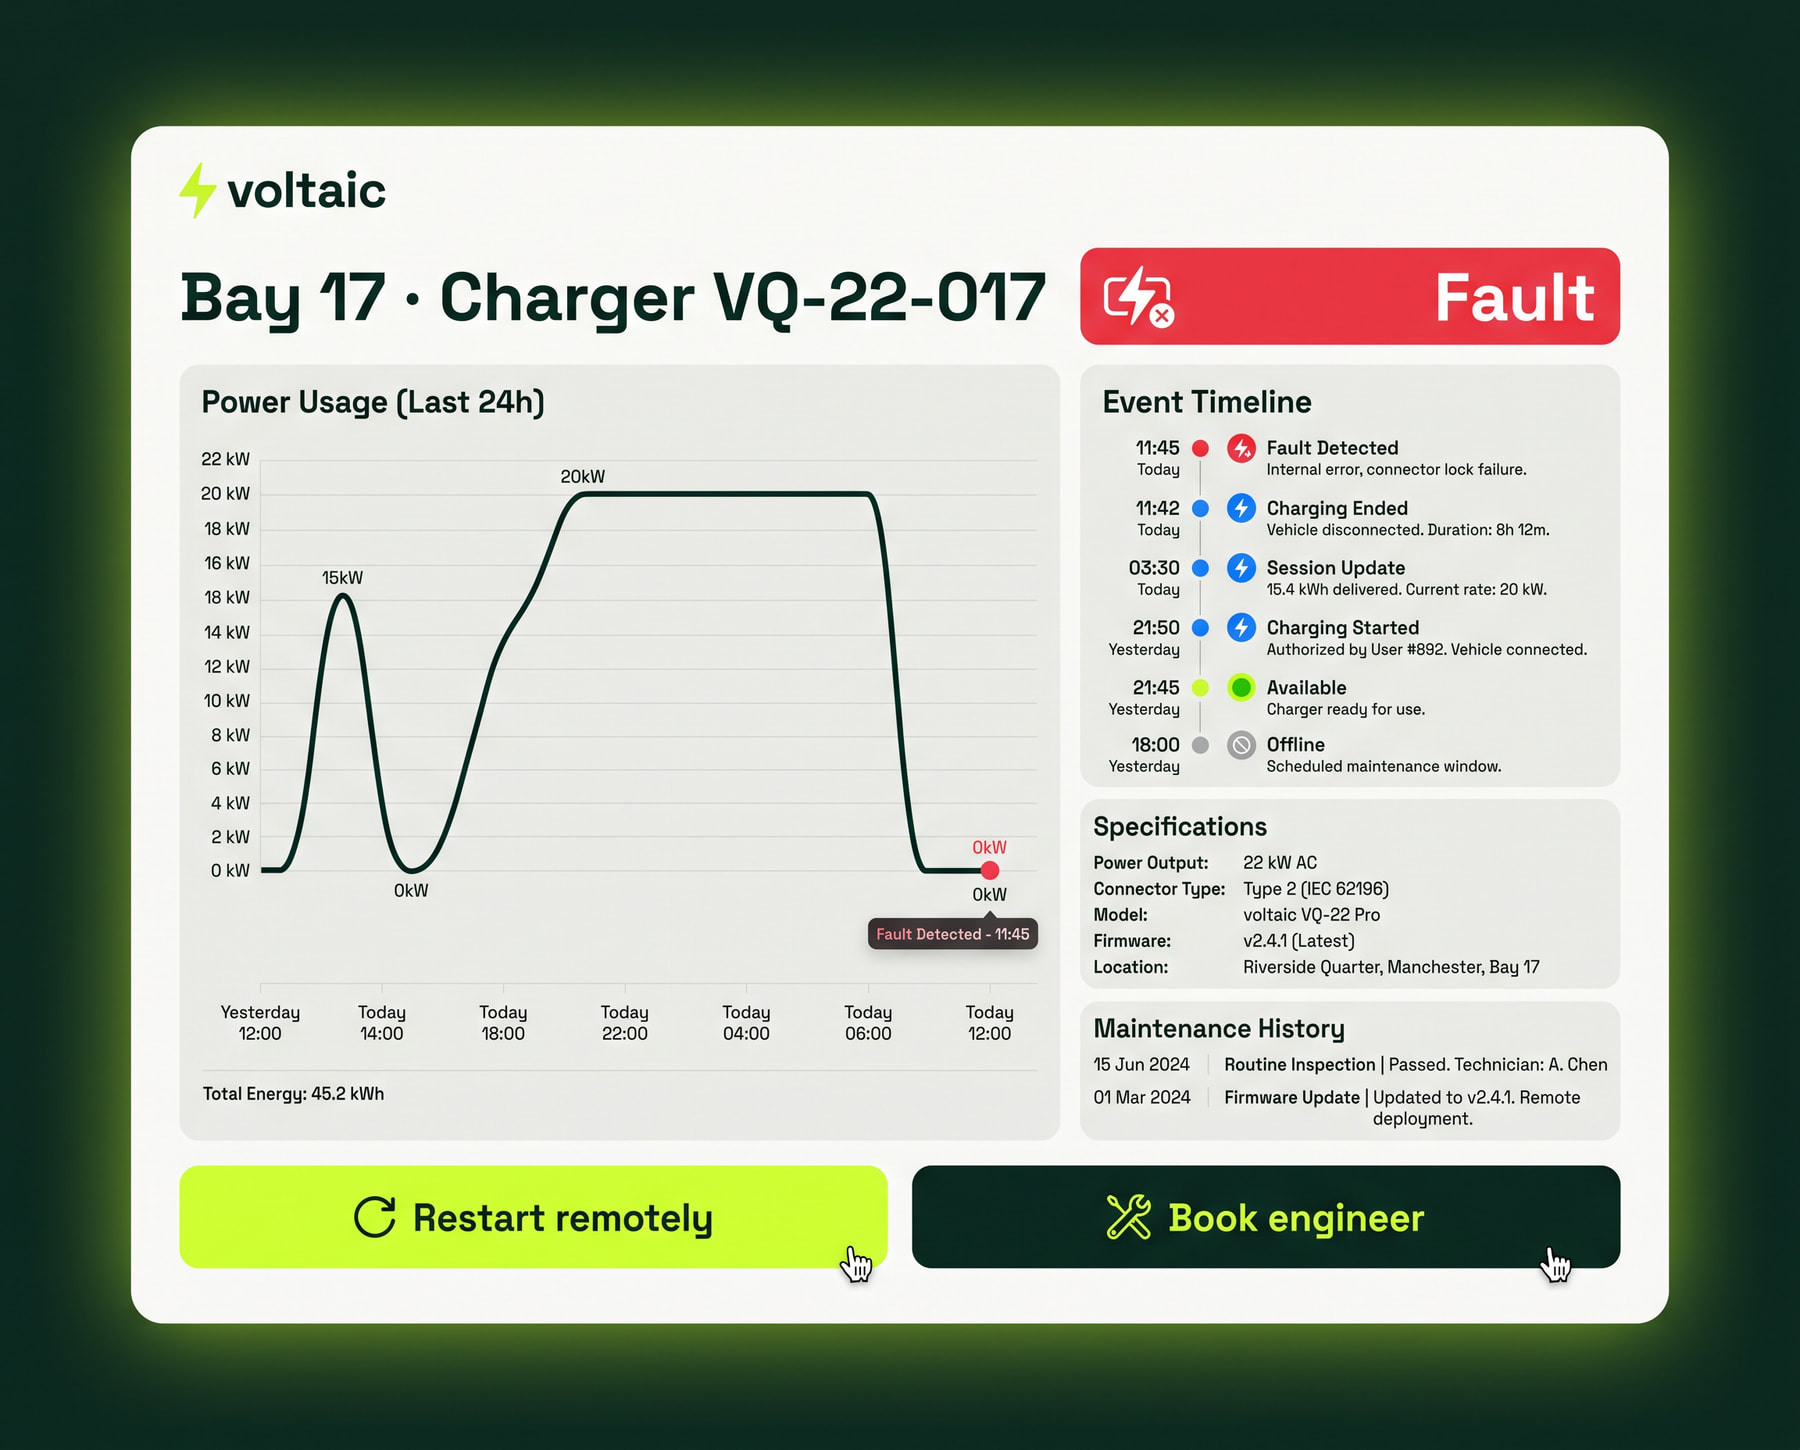
From fault to fixed

A charger's page tells the story of a fault, from first error to engineer visit. Status always shows an icon and a word as well as a colour, so it reads in bright sunlight and for colour-blind users.
Resident app

Plug in, tap, done

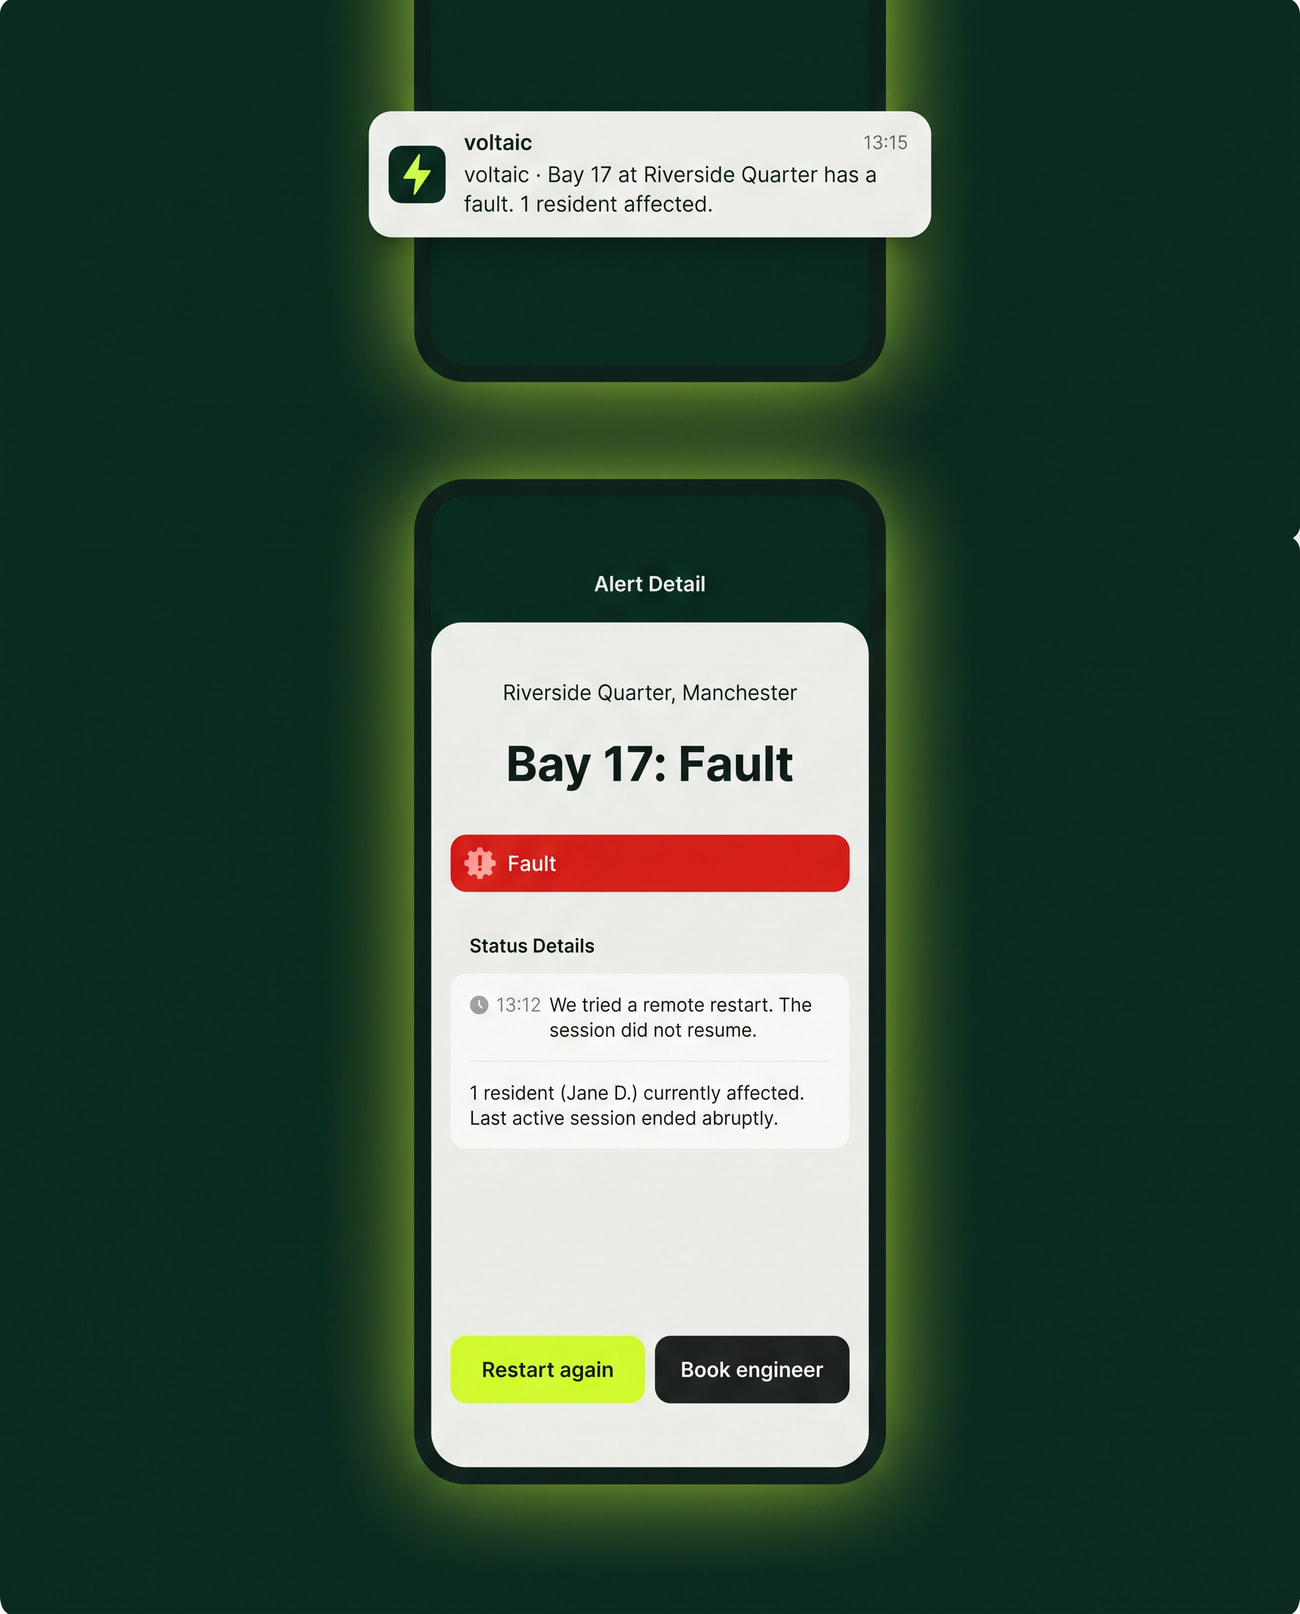
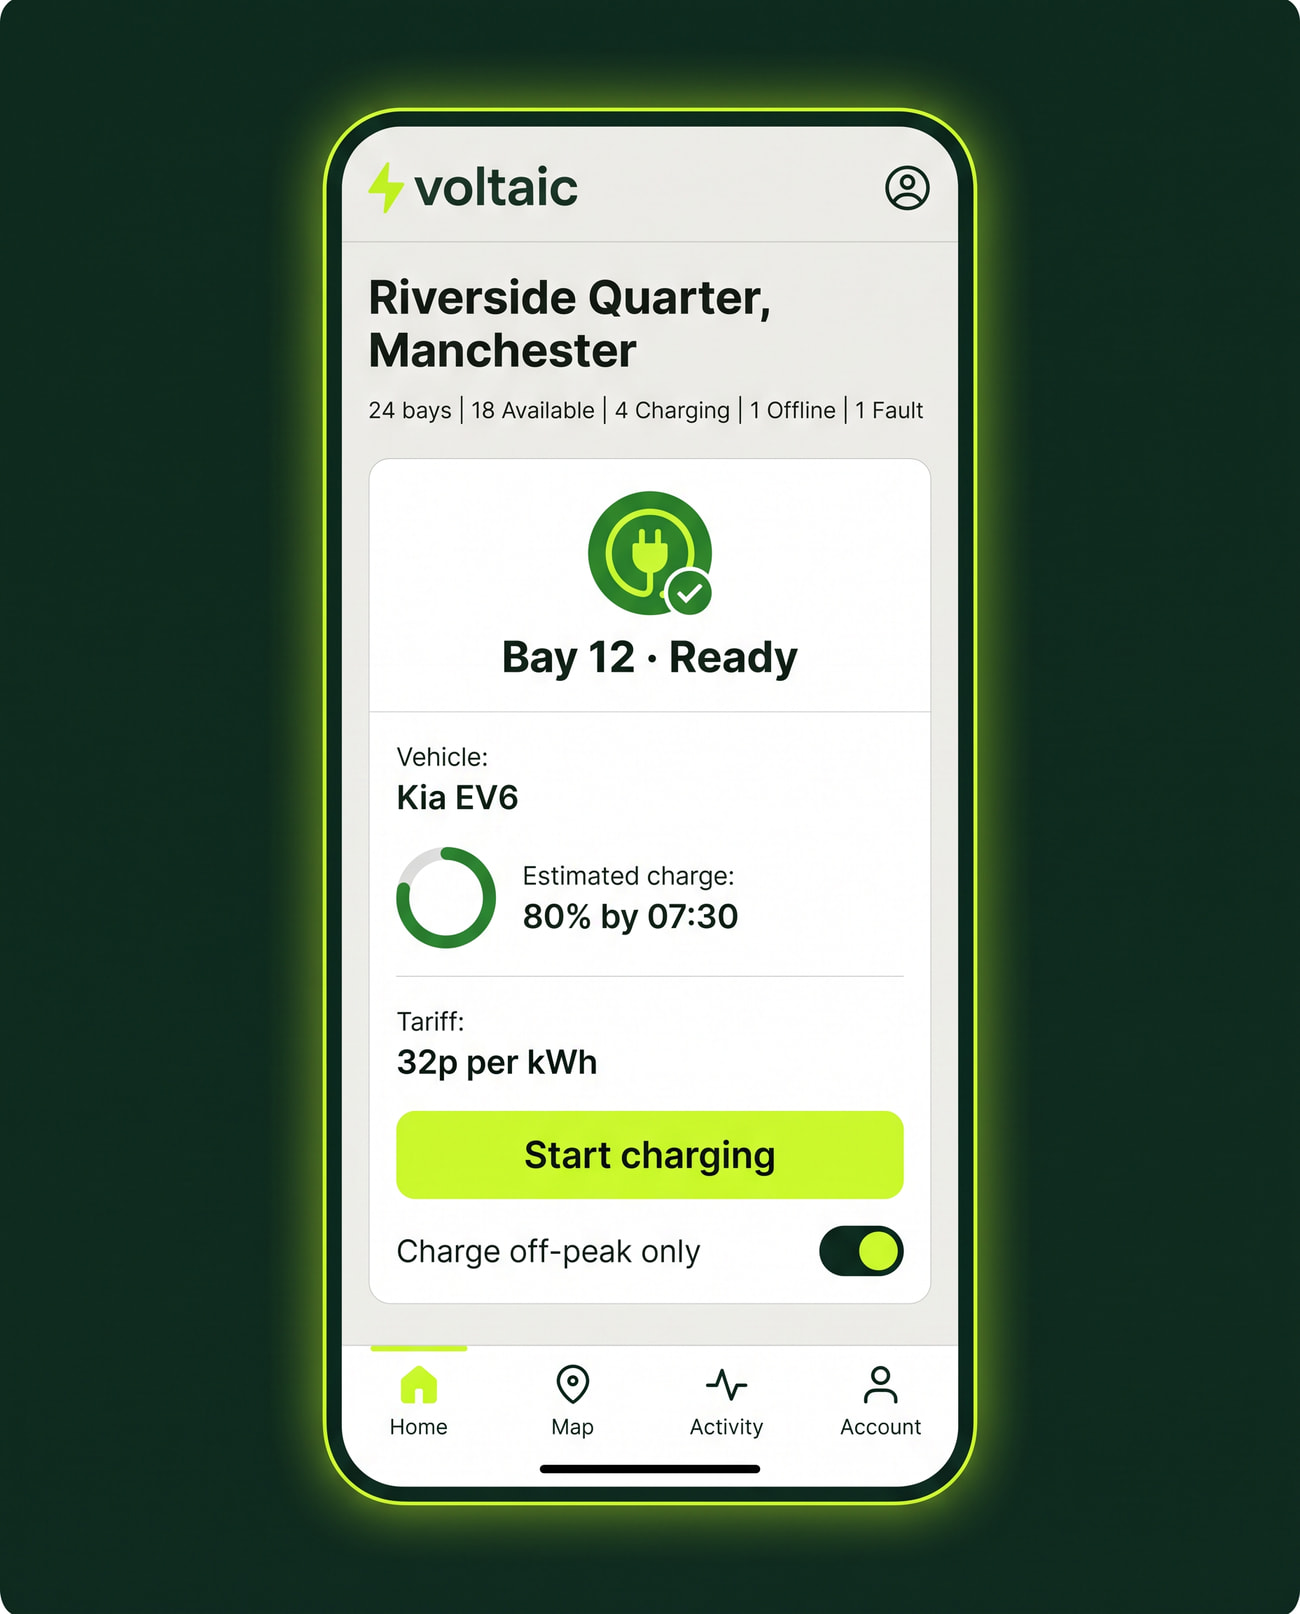
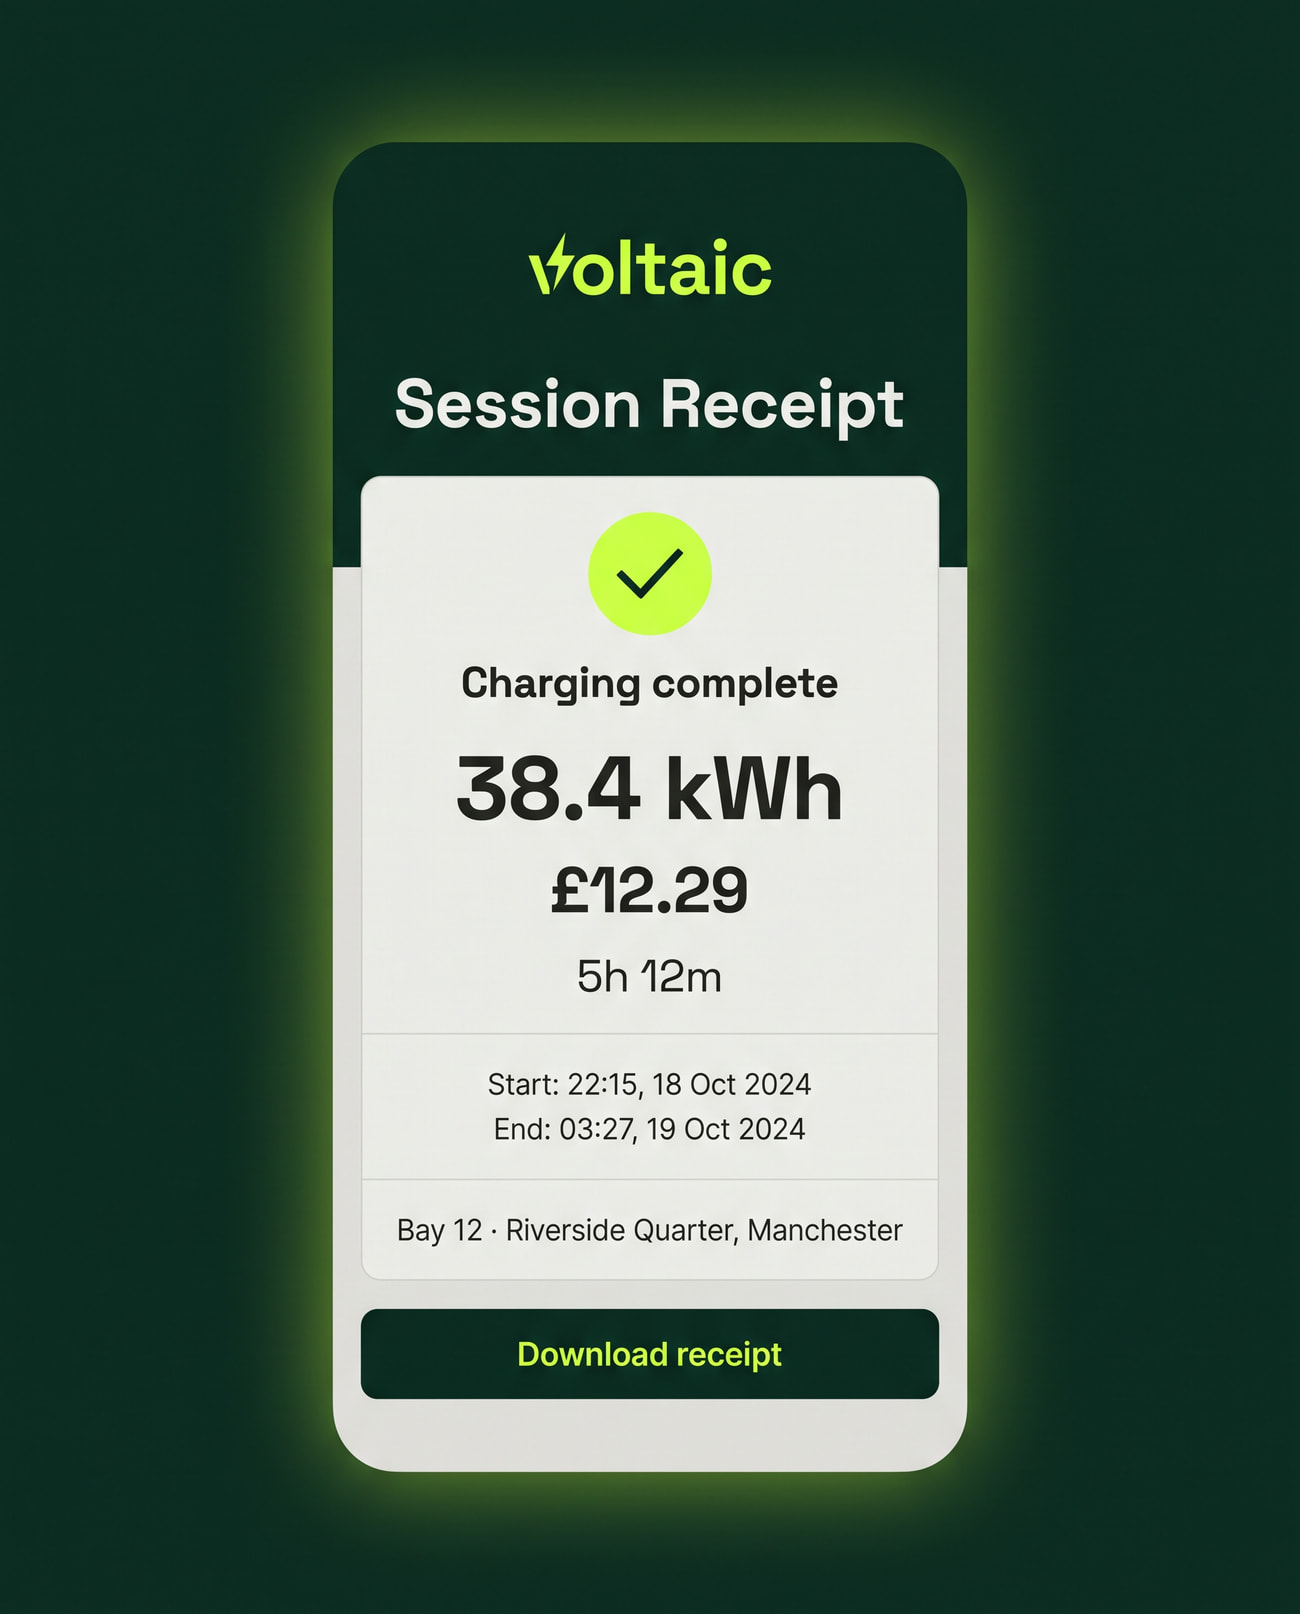
Residents start a charge with one tap and get a clear receipt when it's done. If their bay develops a fault, the app points them to a free one nearby and says when it will be fixed.
Earnings without the spreadsheet
Reports

Earnings without the spreadsheet

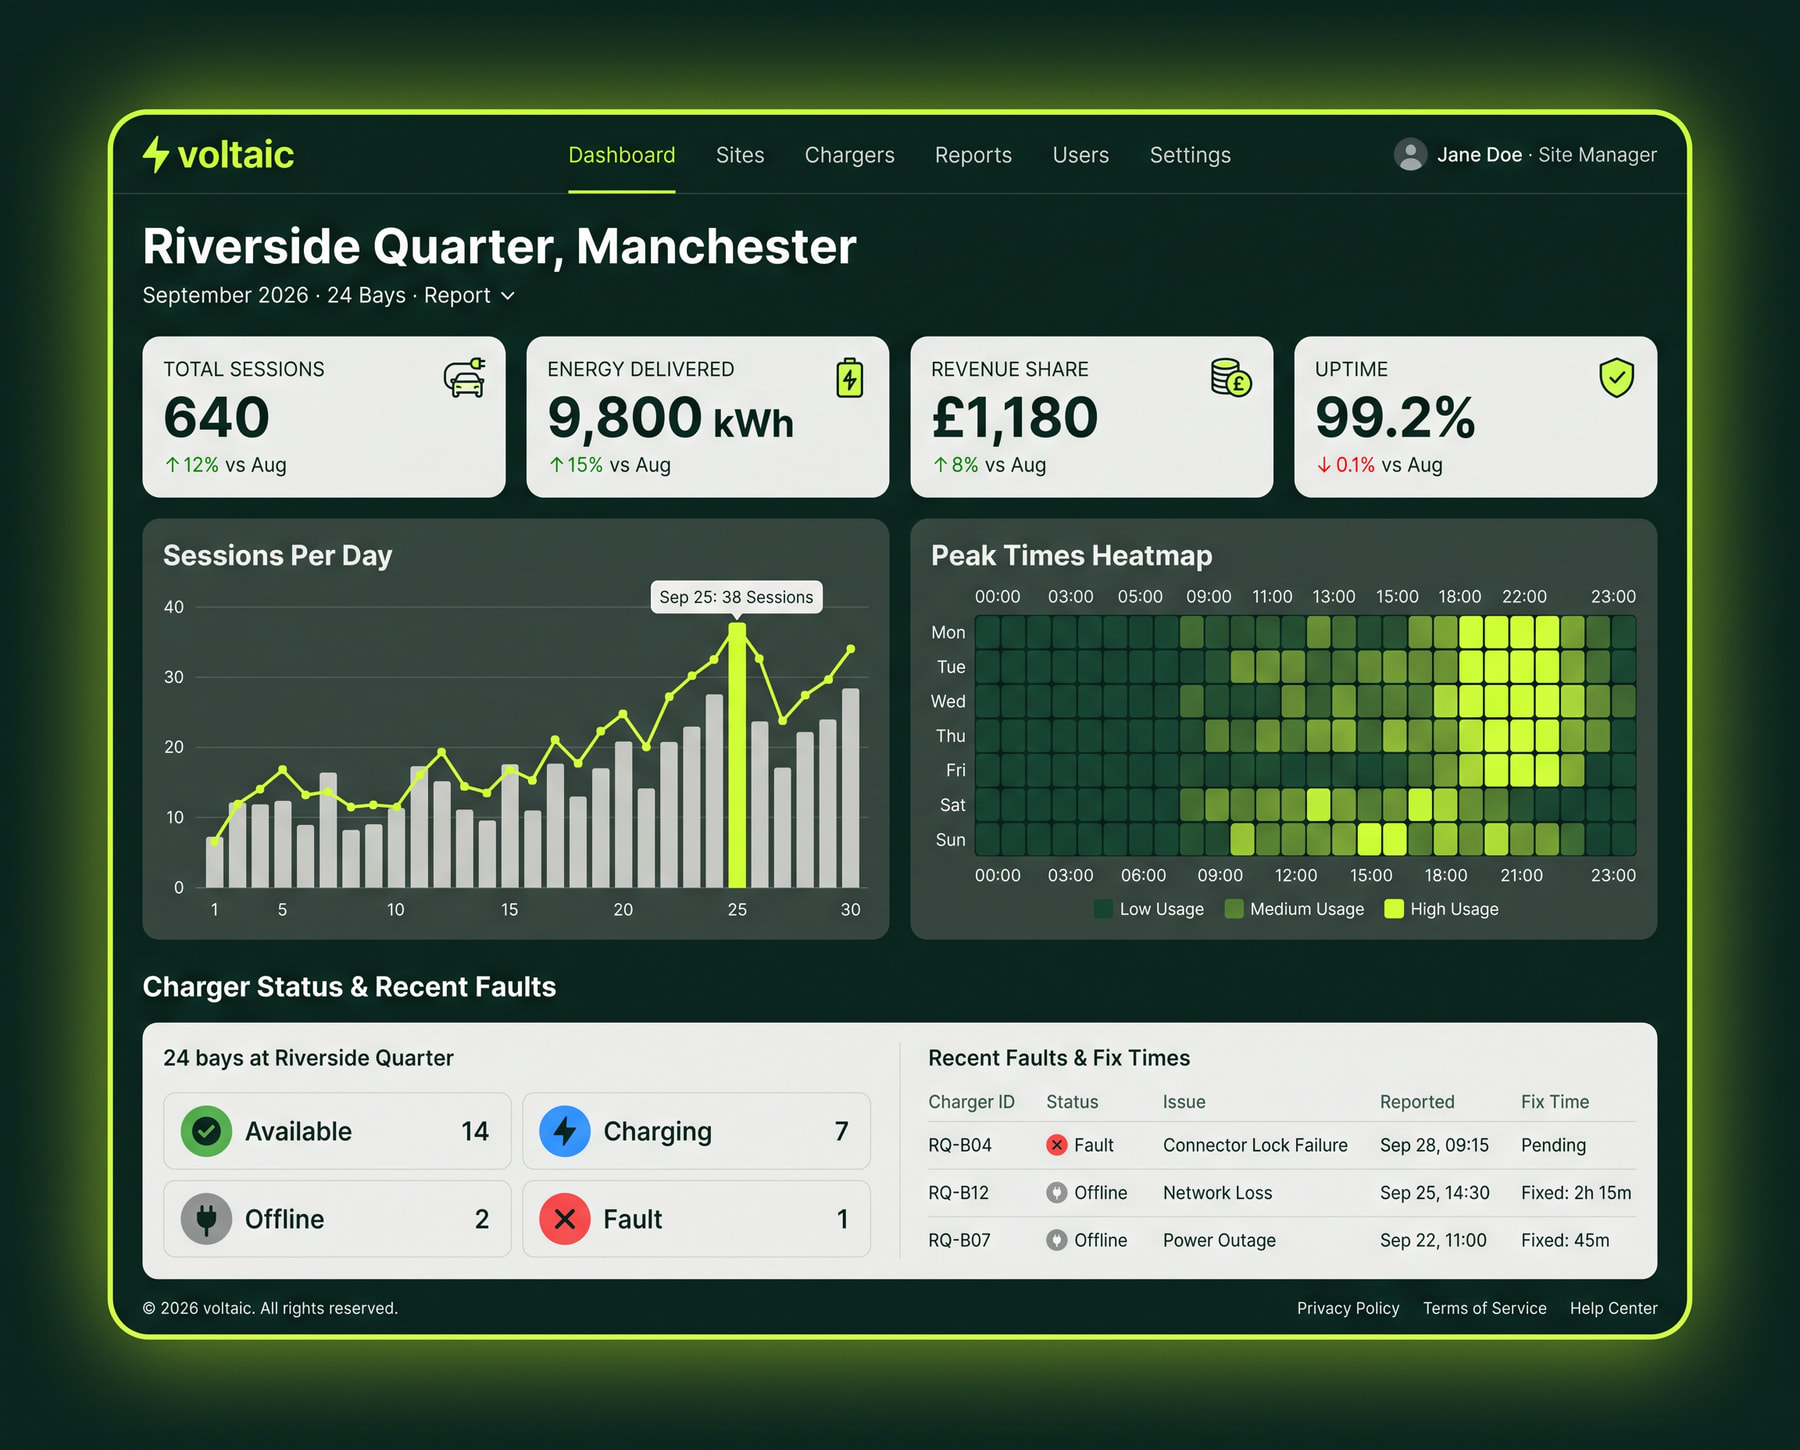
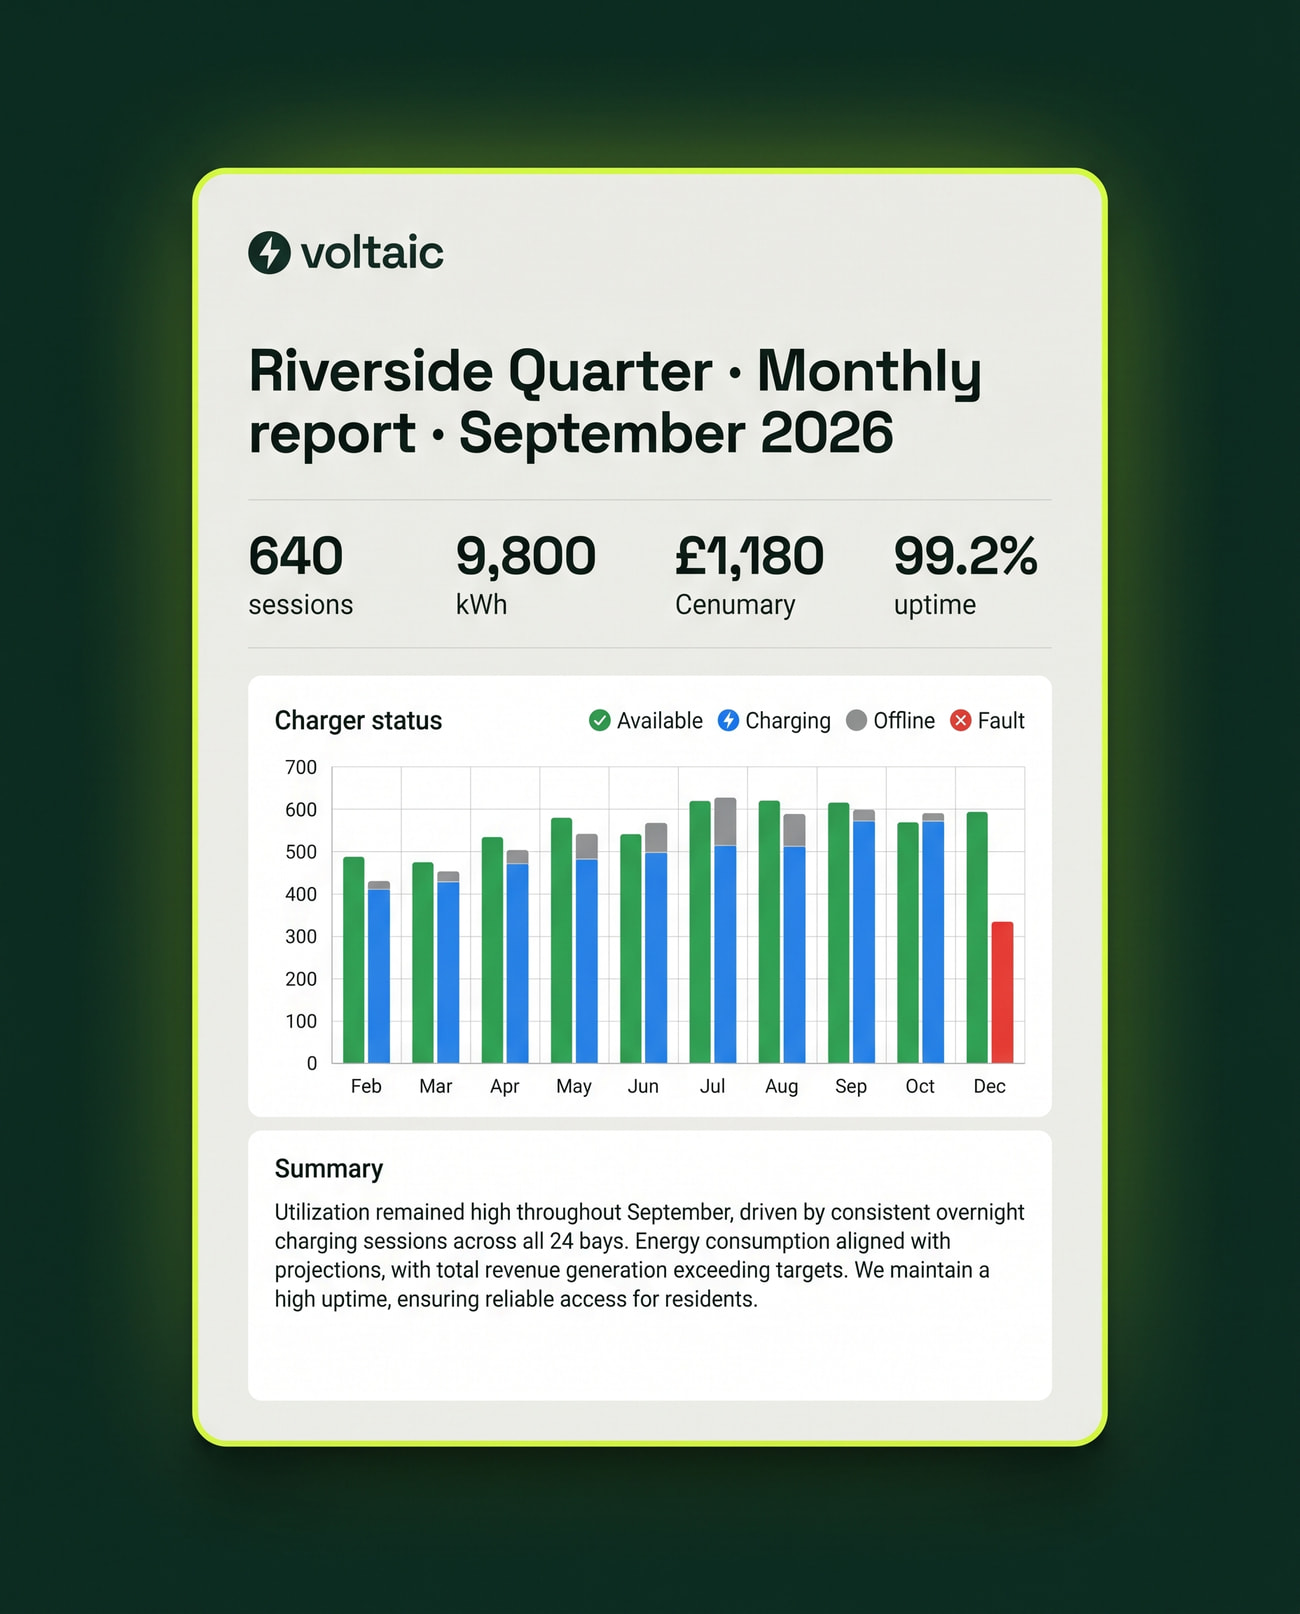
Monthly reports show sessions, energy delivered, revenue share and uptime, ready to forward to a landlord or a residents' committee as a PDF.
To a full cost estimate for a building
3 inputs
Per site, with faults at the top
1 map
Each with an icon, a word and a colour
4 states

Building something like this?

I design and build SaaS products and marketing sites for growing tech companies. Tell me what you're working on.

Let's talk
More
work